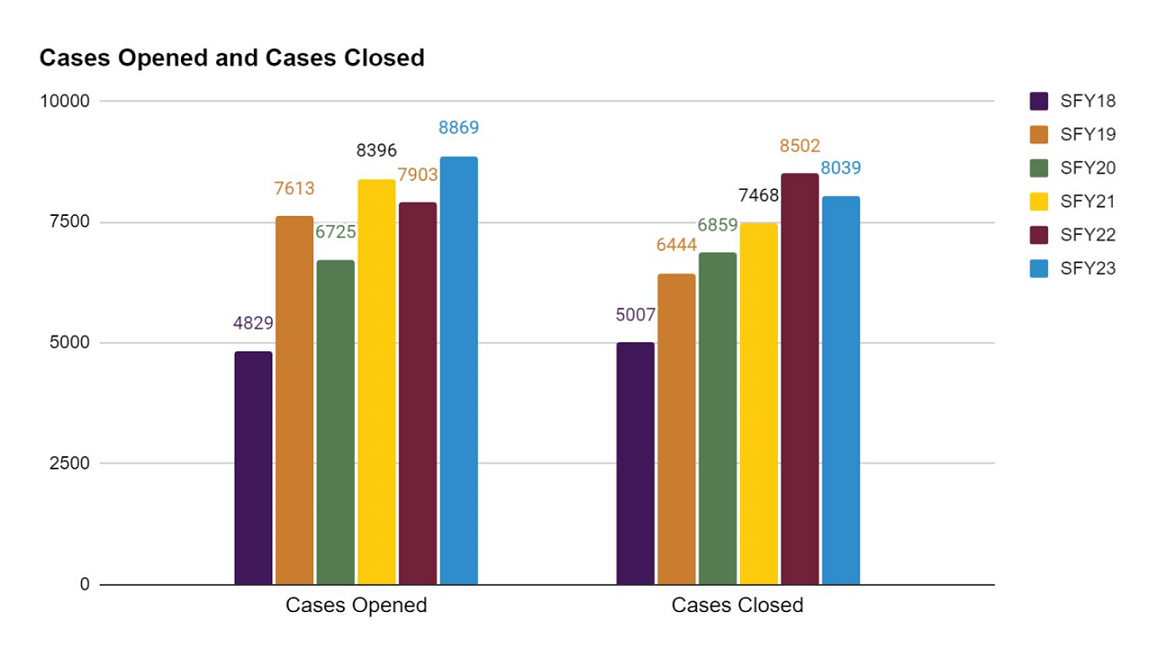
The Office of Inspector General opens, and closes, thousands of cases each year. These investigations are often extremely complicated and may take many months, even years, to conclude.
In SFY 2023, OIG opened 8,869 cases, more than in any of the five prior years, and closed 8,039 cases, down from 8,502 in SFY 2022.
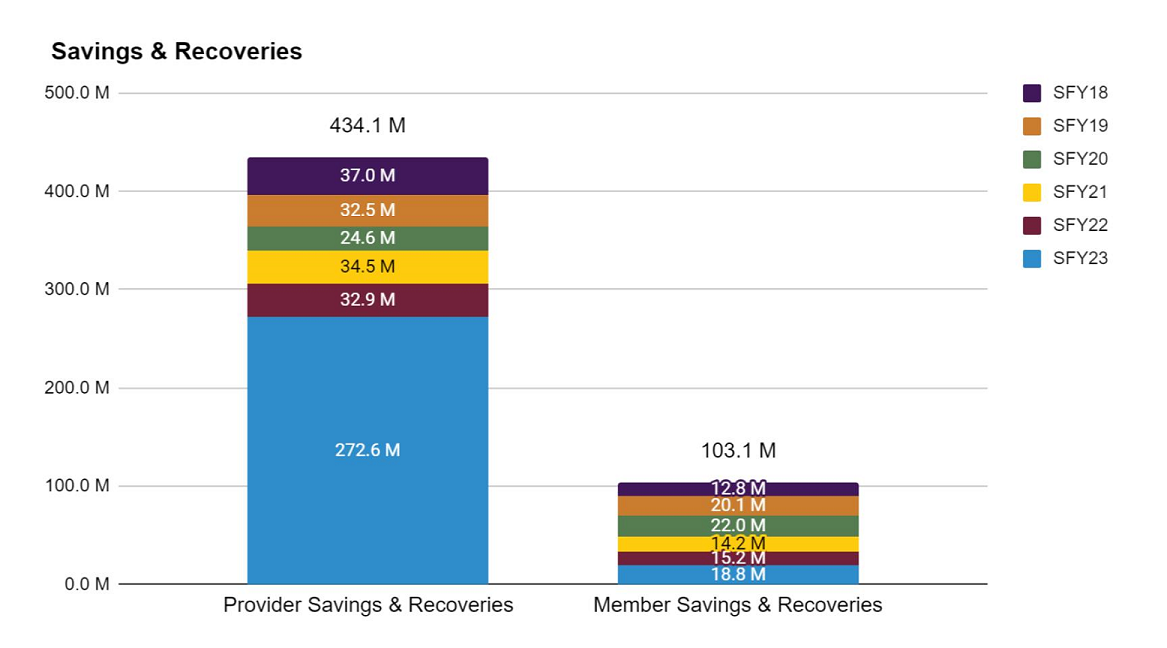
OIG tracks provider and member savings and recoveries by year. In SFY 2023, OIG achieved $272.6 million in provider savings and recoveries, for a total of $434.1 million over the past six fiscal years, and $18.8 million in member savings and recoveries for a total of $103.1 million over the past six state fiscal years.
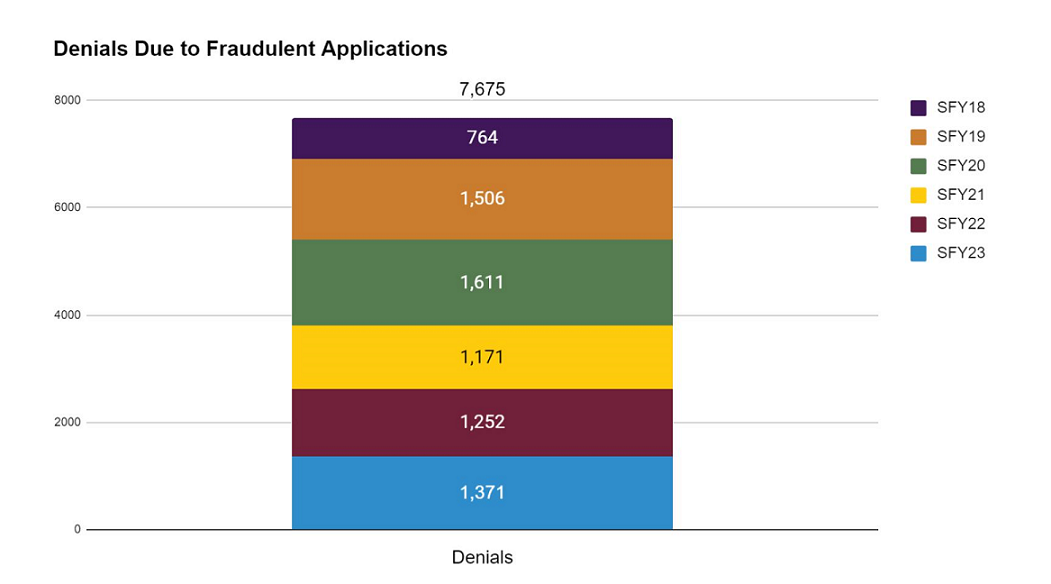
Hundreds of fraudulent applications are investigated each year and denied before the applicant can access Medicaid benefits.
In SFY 2023, 1,371 fraudulent applications were denied.
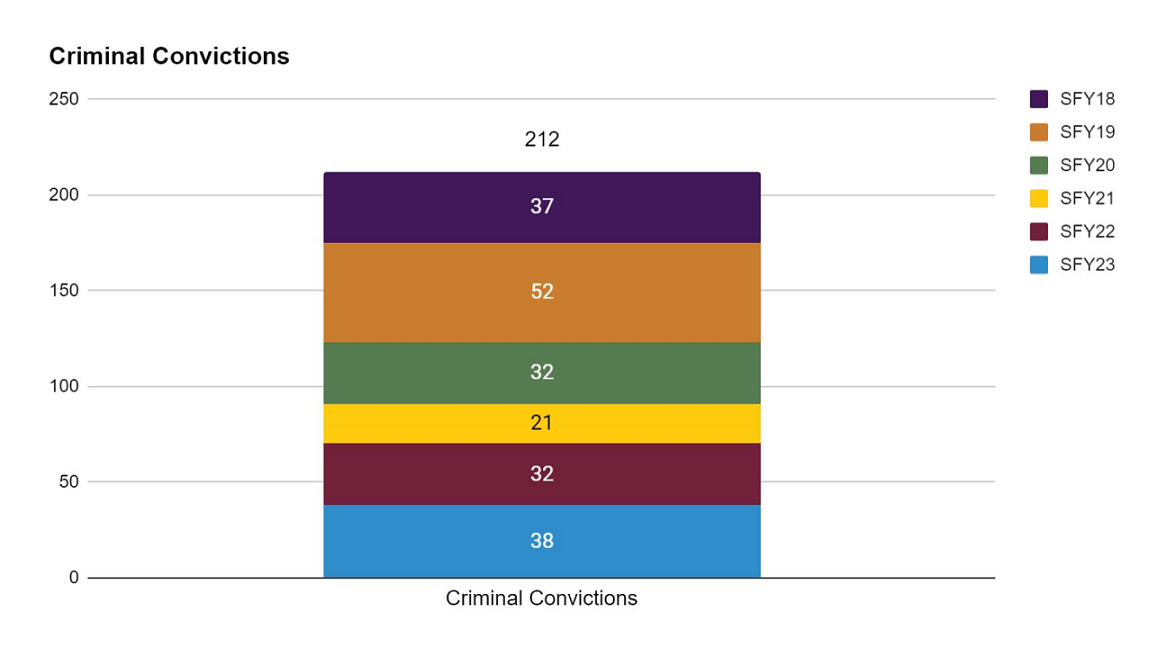
OIG refers criminal matters to law enforcement partners who conduct investigations and prosecutions. In SFY 2023, 38 cases referred to law enforcement resulted in criminal convictions.